At 7.96, the Dow Jones Industrial Average measured in how many ounces of gold it takes to buy the 30 stock Dow is only 13.2% from its 17-year March 6, 2009 low of 7.03. But, as the chart below shows, the ratio has been in a fairly flat, two-year trading range as it moved from long-term support to resistance.
Despite good gains for the Dow since March 2009, the Dow-gold ratio remains just above its March low and 82% below its 1999 peak of 44.56.(Note the price of the Dow is adjusted for dividends paid.)
Here is a chart showing the current Dow to gold ratio, the ratio of the price of the Dow Jones Industrial Average to the price of gold. When measured in ounces of gold, the Dow has been in a secular bear market since peaking in late 1999 at nearly 45.
[Click all to enlarge]
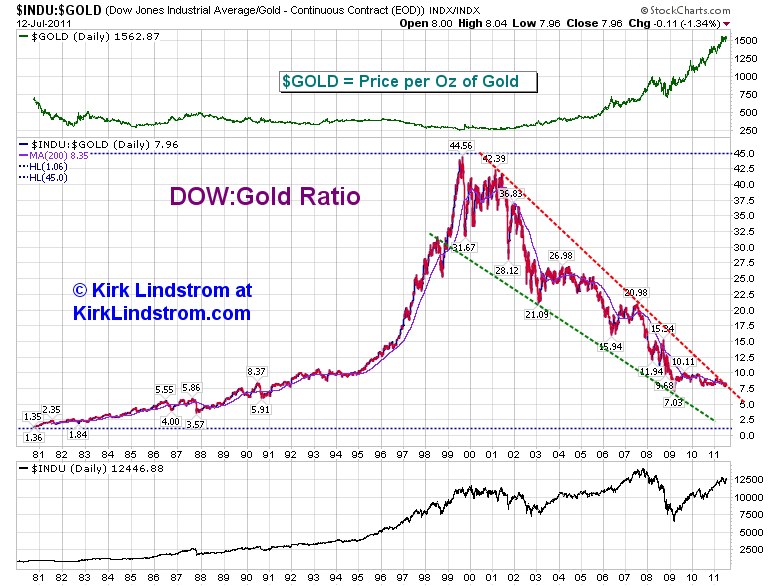
The markets, measured by the S&P500 and DJIA, may have recovered to new highs in 2007, but the Dow-gold ratio told a different, truer story of just how unhealthy the US economy was. Back in 1999, it took nearly 45 ounces of gold to buy the DJIA. On March 6, 2009, the Dow-gold ratio hit a 17-year low of 7.03. As of July 8, it only takes 7.96 ounces of gold to buy the Dow.
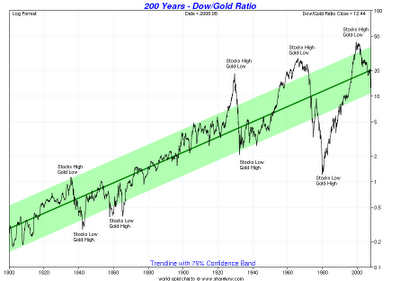
All Time Lows:
The DJIA-to-gold ratio got down near 1 in the early 1980s and was just under 0.2 in the early 1800s. This 200-year Dow/gold chart (courtesy of sharelynx.com) shows the Dow-gold ratio from 1800 through August 2008.
How to trade
Unless you worry about an Armageddon where you could lose access to your investment, one of the safest and easiest ways to trade gold is through an ETF. The fund managers buy and store the metal for you so you don't have to worry about storage costs or security. The major disadvantage is that if the whole financial system melts down, you may lose access to your investment. For that reason, many who want to hedge against inflation and an Armageddon-type event will buy gold bars and coins.
ETF data for Gold (GLD) as of July 12:
GLD Price: $152.75 (only 0.6% below its 52-week high)
GLD 52-week high = $153.61
POG: Price of Gold = $1,562.87
My favorite GLD Charts and Intraday GLD Chart
According to Seeking Alpha, the SPDR Gold Trust ETF has an expense ratio of 0.93%, which I think is wrong. Yahoo says the expense ratio is 0.40%, which I believe is correct.
- Average Bid Ask Ratio: 100%
- Tracking Error: 0.00%
- Concentration Risk of 100.00% (all assets in gold)
- Yahoo says GLD has net assets of $60.68B, as of April 30
- DIA Price = $124.33
- Dow Jones Industrial Average Closing Price =12,446.88
Disclosure: I am long SPY.
No comments:
Post a Comment